Question 66
MCQHard
Question and response
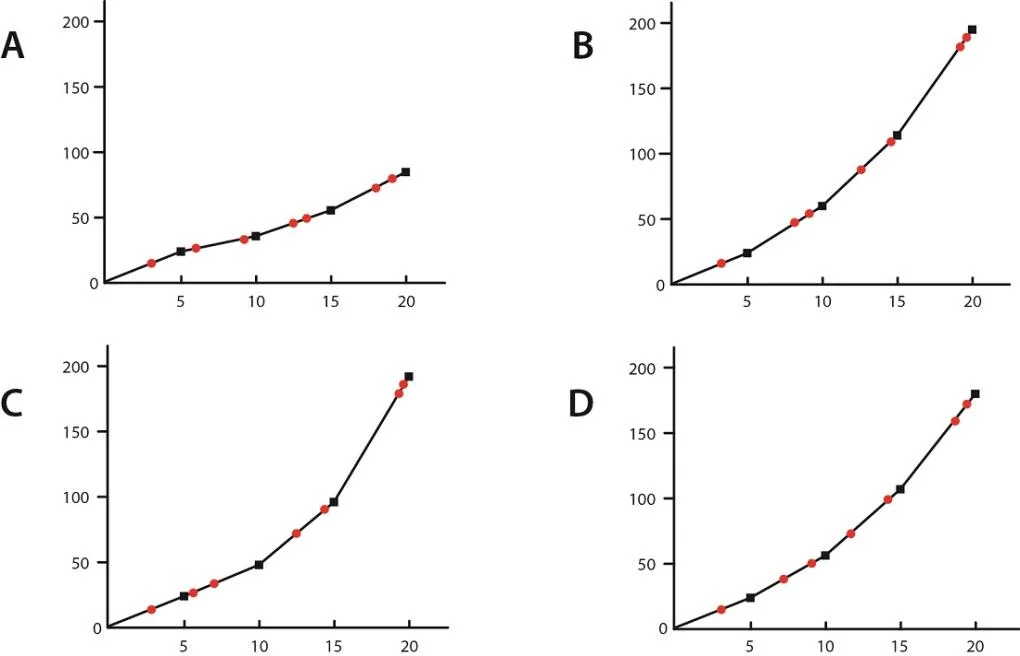
India and Australia are playing the finals of World Cup T20 cricket match. India won
the toss and decided to bat. At the end of 5 overs, India scored 24 runs with one
wicket down. From there on, in every 5 overs, India scored 50% more runs than the
previous 5 overs and lost two wickets. From the options, identify the correct graph
that shows India’s final score.
Enlarge
What this question tests
Syllabus topics
Analytical and Logical Reasoning